如何查看PostgreSQL中的buffer,并清空buffer cache(shared_buffer)
在 PostgreSQL 16 之前原生版本中,除了重新启动实例外,没有其他方法可以清除缓冲区缓存。没有像 Oracle 中 FLUSH BUFFER_CACHE 这样直接用于清空数据库缓存的命令。PostgreSQL 的缓存管理主要依赖于操作系统和自身的共享内存 ,在近期发布的 PostgreSQL 17 中pg_buffercache_evict可以实现,当然,清除缓冲区缓存并不是您通常想要在生产环境中执行的操作,但这对于教育或调试目的来说非常方便。这也是为什么将其作为开发人员功能的原因。为了访问 pg_buffercache_evict 函数,您需要安装pg_buffercache扩展,之前的版本中也可以安装. 下面演示该功能。
安装pg_buffercache扩展
[postgres@mogdb1 ~]$ psql bv
psql (17.0)
Type "help" for help.

postgres=# select version();
                                                 version
---------------------------------------------------------------------------------------------------------
 PostgreSQL 17.0 on x86_64-pc-linux-gnu, compiled by gcc (GCC) 4.8.5 20150623 (Red Hat 4.8.5-36), 64-bit
(1 row)

postgres=# \dx
                                            List of installed extensions
        Name        | Version |   Schema   |                              Description
--------------------+---------+------------+------------------------------------------------------------------------
 pg_prewarm         | 1.2     | public     | prewarm relation data
 pg_stat_statements | 1.11    | public     | track planning and execution statistics of all SQL statements executed
 pgcrypto           | 1.3     | public     | cryptographic functions
 plpgsql            | 1.0     | pg_catalog | PL/pgSQL procedural language
(4 rows)

postgres=# create extension pg_buffercache;
CREATE EXTENSION
postgres=# \dx
                                            List of installed extensions
        Name        | Version |   Schema   |                              Description
--------------------+---------+------------+------------------------------------------------------------------------
 pg_buffercache     | 1.5     | public     | examine the shared buffer cache
 pg_prewarm         | 1.2     | public     | prewarm relation data
 pg_stat_statements | 1.11    | public     | track planning and execution statistics of all SQL statements executed
 pgcrypto           | 1.3     | public     | cryptographic functions
 plpgsql            | 1.0     | pg_catalog | PL/pgSQL procedural language
(5 rows)

postgres=# \dfS *evict*
                               List of functions
 Schema |         Name         | Result data type | Argument data types | Type
--------+----------------------+------------------+---------------------+------
 public | pg_buffercache_evict | boolean          | integer             | func
(1 row)


postgres=# \d pg_buffercache
                 View "public.pg_buffercache"
      Column      |   Type   | Collation | Nullable | Default
------------------+----------+-----------+----------+---------
 bufferid         | integer  |           |          |
 relfilenode      | oid      |           |          |
 reltablespace    | oid      |           |          |
 reldatabase      | oid      |           |          |
 relforknumber    | smallint |           |          |
 relblocknumber   | bigint   |           |          |
 isdirty          | boolean  |           |          |
 usagecount       | smallint |           |          |
 pinning_backends | integer  |           |          |
- 安装名为 pg_buffercache 的扩展程序后,pg_buffercache视图列:
bufferid,服务器缓冲区缓存中的块 ID
relfilenode,这是关系数据所在的文件夹名称
reltablespace,表空间关系用途的 Oid
reldatabase,location 所在数据库的 Oid
relforknumber,关系中的分叉号
relblocknumber,关系中的年龄数字
isdirty,如果页面很脏则为 true
usagecount,页面 LRU(最近最少使用)计数
pinning_backends,有关缓冲区引脚的信息
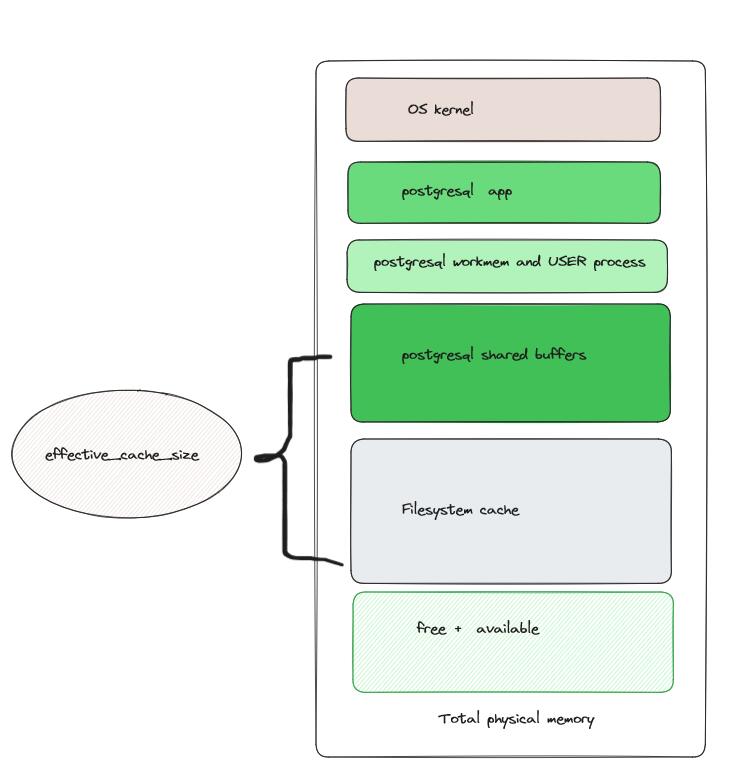
参数shared_buffers 的大小和8KB的block 大小,可以记算出cache 多个,buffer装满也基本匹配pg_buffercache中的行数。
创建测试表
postgres=# create table t ( a int, b text );
CREATE TABLE
postgres=# insert into t select i, i::text from generate_series(1,10000) i;
INSERT 0 10000
postgres=# select pg_prewarm ( 't', 'buffer', 'main', null, null );
 pg_prewarm
------------
         54
(1 row)
Note: 使用pre_warm扩展并完全加载我创建的表T到buffer中,加载了54个block。
检查buffer个数
postgres=# select oid from pg_class where relname='t';
  oid
-------
 16483
(1 row)

postgres=# select count(*) from pg_buffercache where relfilenode = 16483;
 count
-------
    58
(1 row)
Note:
注意对应的表对象T加载了58个block,为什么呢?因为可见性和可用空间文件。
多出的block是什么?
postgres=# show data_directory;
 data_directory
-----------------
 /opt/pgsql/data
(1 row)

postgres=#  select pg_relation_filepath('t');
 pg_relation_filepath
----------------------
 base/5/16483
(1 row)

postgres=# select relforknumber from pg_buffercache where relfilenode = 16401 and relforknumber != 0;
 relforknumber
---------------
             1
             1
             1
             2
(4 rows)

postgres=# select relforknumber,count(*) from  pg_buffercache where relfilenode =16483 group by relforknumber;
 relforknumber | count
---------------+-------
             0 |    54
             1 |     3
             2 |     1
(3 rows)
Relforknumber
Fork number within the relation; see common/relpath.h
common/relpath.h

enum  	ForkNumber {
  InvalidForkNumber = -1 , MAIN_FORKNUM = 0 , FSM_FORKNUM , VISIBILITYMAP_FORKNUM ,
  INIT_FORKNUM
}
检查操作系统文件
[postgres@mogdb1 ~]$ cd  /opt/pgsql/data

[postgres@mogdb1 data]$ cd base/5
[postgres@mogdb1 5]$ ls -l 16483*
-rw------- 1 postgres postgres 442368 Oct 17 21:01 16483
-rw------- 1 postgres postgres  24576 Oct 17 21:01 16483_fsm    -- 3 blocks
-rw------- 1 postgres postgres   8192 Oct 17 21:01 16483_vm     -- 1 blocks
ChartGPT 给的替代方案
”
1. 释放操作系统缓存
可以通过操作系统命令释放操作系统的缓存(这也会影响 PostgreSQL 的缓存)。在 Linux 系统上,可以使用以下命令:sync; echo 3 > /proc/sys/vm/drop_caches
说明:这会清除操作系统的缓存,而不仅仅是 PostgreSQL 的缓存。使用前需谨慎,因为它可能对系统的其他进程产生影响。
“
[root@mogdb1 ~]# sync; echo 3 > /proc/sys/vm/drop_caches

postgres=# select count(*) from pg_buffercache where relfilenode =16483;
 count
-------
    58
(1 row)
Note:
注意这次ChartPGT错了,所以不要完全相信大模型。
isdirty
postgres=# select isdirty,count(*) from  pg_buffercache where relfilenode =16483 group by isdirty;
 isdirty | count
---------+-------
 f       |    58
(1 row)


postgres=# begin;
BEGIN
postgres=*# update t set b=11 where a=1;
UPDATE 1

postgres=# select isdirty,count(*) from  pg_buffercache where relfilenode =16483 group by isdirty;
 isdirty | count
---------+-------
 f       |    54
 t       |     4
(2 rows)
统计每个库cache blocks
postgres=# SELECT  CASE  WHEN  c.reldatabase IS  NULL  THEN  ''
WHEN  c.reldatabase = 0 THEN  ''
ELSE  d.datname
END  AS  database,
count(*) AS  cached_blocks
FROM  pg_buffercache AS  c
LEFT  JOIN  pg_database AS  d
ON  c.reldatabase = d.oid
GROUP  BY  d.datname, c.reldatabase
ORDER  BY  d.datname, c.reldatabase;

 database  | cached_blocks
-----------+---------------
 postgres  |           489
 template1 |            84
           |            14
           |         15797
(4 rows)
统计TOP 10 表的cache blocks
postgres=# SELECT c.relname, count(*) AS buffers
postgres-# FROM pg_buffercache b INNER JOIN pg_class c
ON b.relfilenode = pg_relation_filenode(c.oid) AND
b.reldatabase IN (0, (SELECT oid FROM pg_database
WHERE datname = current_database()))
GROUP BY c.relname
ORDER BY 2 DESC
LIMIT 10;

             relname             | buffers
---------------------------------+---------
 pg_proc                         |     104
 t                               |      58
 pg_attribute                    |      42
 pg_class                        |      18
 pg_statistic                    |      18
 pg_proc_proname_args_nsp_index  |      17
 pg_operator                     |      14
 pg_proc_oid_index               |      12
 pg_attribute_relid_attnum_index |       9
 pg_type                         |       8
(10 rows)
buffer对SQL性能优化
postgres=#  explain(analyze,buffers,verbose) select * from t;
                                                 QUERY PLAN
------------------------------------------------------------------------------------------------------------
 Seq Scan on public.t  (cost=0.00..154.00 rows=10000 width=8) (actual time=0.034..0.902 rows=10000 loops=1)
   Output: a, b
   Buffers: shared hit=54
 Planning Time: 0.066 ms
 Execution Time: 1.401 ms
(5 rows)
Note:
注意执行时间1.4 ms, buffers 54 blocks。下面我们flush buffer cache,清空表的buffer。
pg_buffercache_evict清空buffer
postgres=# select pg_buffercache_evict(bufferid) from pg_buffercache where relfilenode=16483;
 pg_buffercache_evict
----------------------
 t
 t
...
 t
 t
 t
 t
 t
 t
 t
 t
(58 rows)

postgres=# select count(*) from pg_buffercache where relfilenode =16483;
 count
-------
     0
(1 row)
查看清空buffer后的SQL性能
postgres=# explain(analyze,buffers,verbose) select * from t;
                                                 QUERY PLAN
-------------------------------------------------------------------------------------------------------------
 Seq Scan on public.t  (cost=0.00..154.00 rows=10000 width=8) (actual time=0.100..25.730 rows=10000 loops=1)
   Output: a, b
   Buffers: shared read=54
 Planning Time: 0.065 ms
 Execution Time: 26.926 ms
(5 rows)

postgres=# select count(*) from pg_buffercache where relfilenode =16483;
 count
-------
    54
(1 row)

postgres=# select relforknumber from pg_buffercache where relfilenode =16483 and relforknumber != 0;
 relforknumber
---------------
(0 rows)

postgres=# sELECT * FROM pg_buffercache_usage_counts();
 usage_count | buffers | dirty | pinned
-------------+---------+-------+--------
           0 |   15801 |     0 |      0
           1 |     186 |     0 |      0
           2 |      52 |     0 |      0
           3 |      20 |     0 |      0
           4 |      23 |     0 |      0
           5 |     302 |     2 |      0
(6 rows)

postgres=# SELECT * FROM pg_buffercache_summary();
 buffers_used | buffers_unused | buffers_dirty | buffers_pinned |  usagecount_avg
--------------+----------------+---------------+----------------+-------------------
          583 |          15801 |             2 |              0 | 3.351629502572899
(1 row)
Note:
这次执行时间26.9ms, 比之前有buffer时多了25ms. 查询不需要直接访问磁盘上的数据来检索数据,而可以直接依赖缓存,因此数据获取速度更快。
总结:
在postgresql中安装pg_buffercache可以像oracle一样(v$bh) 观察cache buffer中的对象的block缓存数量,出于测试的目的可以使用pg_buffercache_evict 从内存buffer中flush出去,同时buffer可以状态物理I/O提升SQL性能。

 微信扫一扫,打赏作者吧~


对不起,这篇文章暂时关闭评论。