Events latch: cache buffers chains

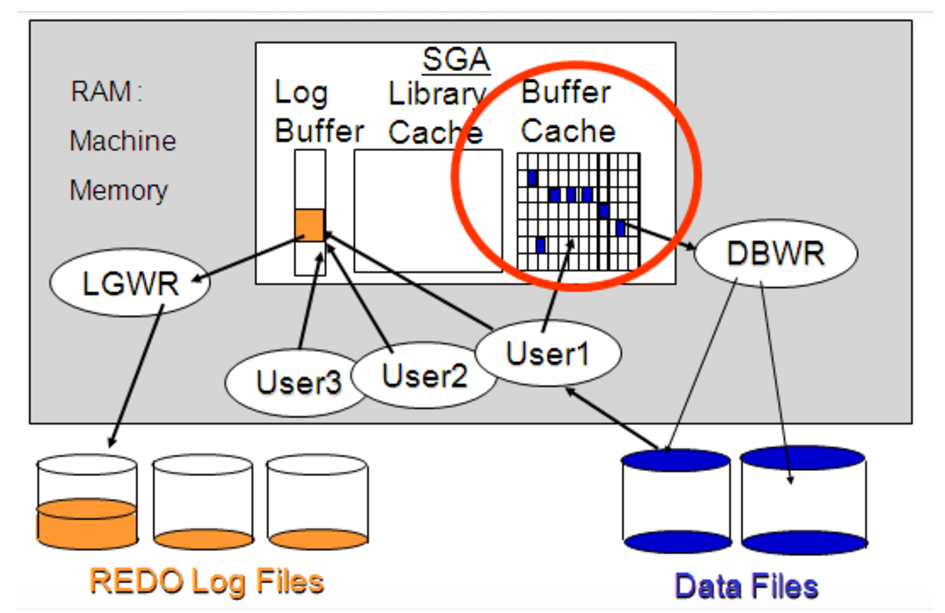
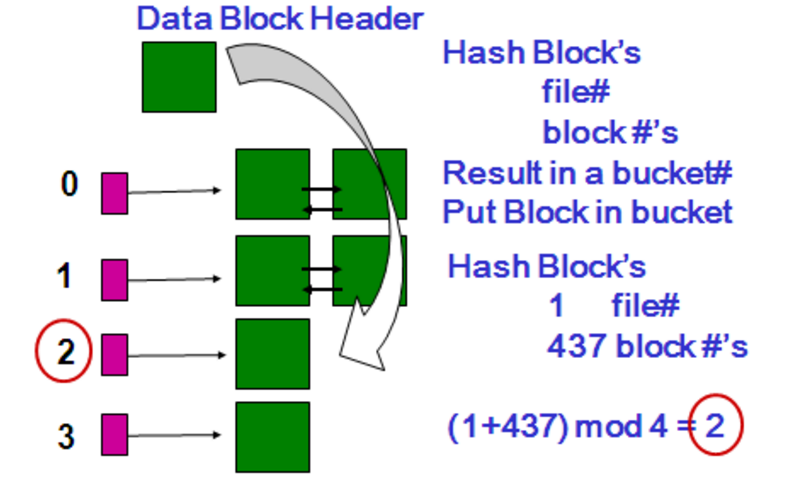
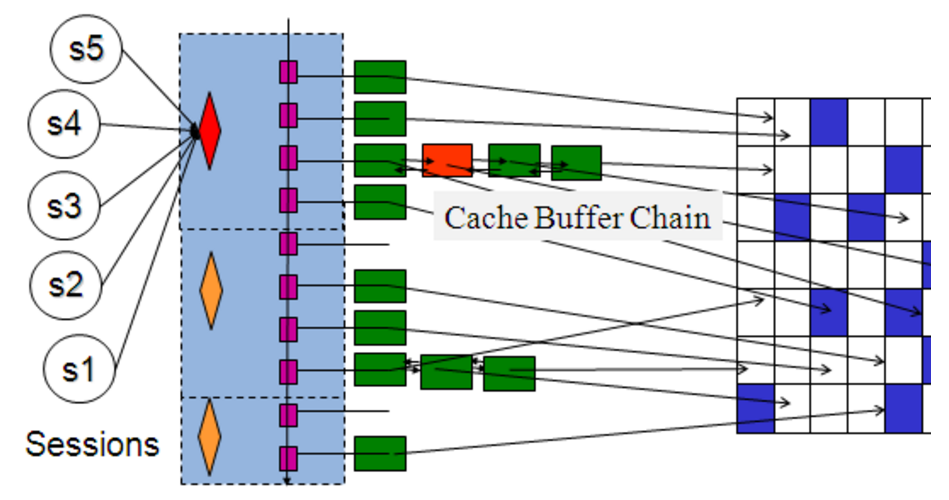
Latches are internal memory structures to coordinate access to shared resources. Each buffer in the buffer cache has an associated element the buffer header array, externalized as x$bh. Buffer headers keeps track of various attributes and state of buffers in the buffer cache. This Buffer header array is allocated in shared pool. These buffer headers are chained together in a doubly linked list and linked to a hash bucket. There are many hash buckets (# of buckets are derived and governed by _db_block_hash_buckets parameter). Access (both inspect and change) to these hash chains are protected by cache buffers chains latches.Further, buffer headers can be linked and delinked from hash buckets dynamically.

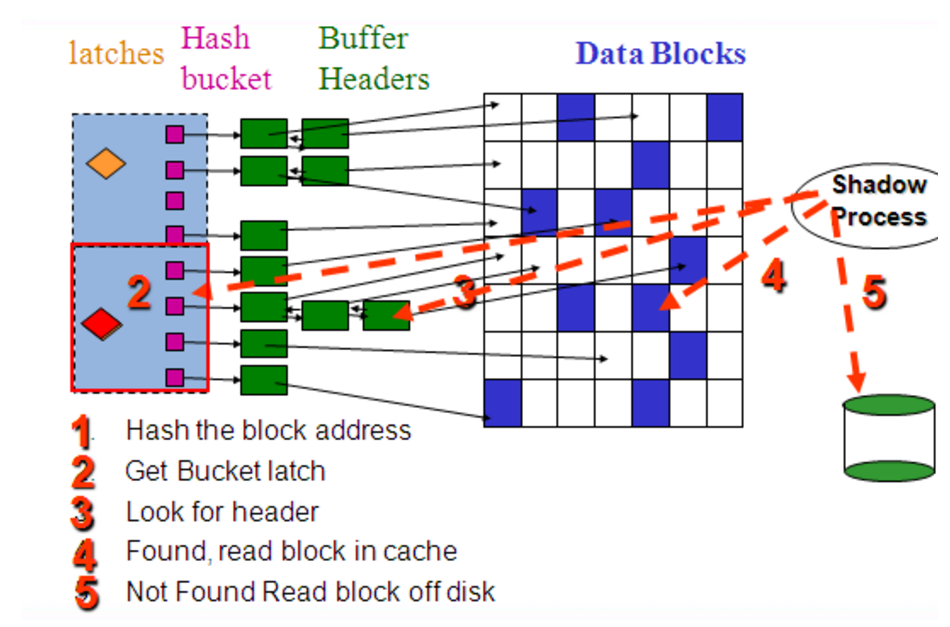
Simple algorithm to access a buffer is: (I had to deliberately cut out so as not to deviate too much from our primary discussion.)
1. Hash data block address (DBA: Combination of tablespace, file_id and block_id) to find hash bucket.
2. Get latch protecting hash bucket.
3. If (success) then Walk the hash chain reading buffer headers to see if a specific version of the block is already in the chain.
If found, access the buffer in buffer cache, with protection of buffer pin/unpin actions.
If not found, then find a free buffer in buffer cache, unlink the buffer header for that buffer from its current chain, link that buffer header with this hash chain, release the latch and read block in to that free buffer in buffer cache with buffer header pinned.
4. If (not success) spin for spin_count times and go to step 2.
5. If this latch was not got with spinning, then sleep, with increasing exponential back-off sleep time and go to step 2.
Hot blocks are another common cause of cache buffers chains latch contention. This happens when multiple sessions repeatedly access one or more blocks that are protected by the same child cache buffers chains latch. This is mostly an application issue.


When sessions compete for the cache buffers chains latches, the best way to find out if you have a hot blocks situation is to examine the P1RAW parameter value of the latch free wait event. The P1RAW parameter contains the latch address. If the sessions are waiting on the same latch address
select sid ,p1raw,p2,p3,seconds_in_wait,wait-time,state
from v$session_wait where event like 'latch: cache buffer%'
order by p2,p1raw;
The next step is to see what blocks are covered by the latch. You should also capture the SQL statements that participate in the competition. This is because a cache buffers chains latch covers many blocks, and you can identify the hot blocks by the tables that are used in the SQL statements. In Oracle8i Database and above, you can identify the hot blocks based on their TCH (touch count) values using the following query. Generally, hot blocks have higher touch count values. However, bear in mind that the touch count is reset to 0 when a block is moved from the cold to the hot end of the LRU list. Depending on the timing of your query, a block with a 0 touch count value is not necessarily cold.
--find object
select /*+ RULE */ o.name, bh.dbarfil, bh.dbablk, bh.tch
from x$bh bh, obj$ o
where tch > 5
  and hladdr='&p1raw'--p1raw
  and o.obj#=bh.obj
order by tch;

SELECT /*+ RULE */
 E.OWNER || '.' || E.SEGMENT_NAME SEGMENT_NAME,
 E.PARTITION_NAME,
 E.EXTENT_ID EXTENT#,
 X.DBABLK - E.BLOCK_ID + 1 BLOCK#,
 X.TCH,
 L.CHILD#
  FROM SYS.V$LATCH_CHILDREN L, SYS.X$BH X, SYS.DBA_EXTENTS E
 WHERE X.HLADDR = '&p1raw'--p1raw
   AND E.FILE_ID = X.FILE#
   AND X.HLADDR = L.ADDR
   AND X.DBABLK BETWEEN E.BLOCK_ID AND E.BLOCK_ID + E.BLOCKS - 1
 ORDER BY X.TCH DESC;

-- or

Converting this latch address P1 from decimal to hex yields XXX. But latch address is 16 bytes and so prefixing with zeros and querying v$latch_children to see activity against that latch children.

select addr, latch#, child#, level#, gets
from v$latch_children where addr='0000XXXX0000XXXX';

select hladdr,  file#, dbablk, decode(state,1,'cur ',3,'CR',state) ST, tch
 from x$bh where hladdr in
  (select addr from  (select addr from v$latch_children  where addr='0000XXXX0000XXXX'
 order by sleeps, misses,immediate_misses desc )where rownum <2)


select addr,gets,misses,sleeps
from v$latch_children
where name='cache buffers chains'
and misses > 100 order by 3 desc;

select file#,dbablk,state,class from x$bh where hladdr='&Laddr';


-- OR
with bh_lc as
(select /*+ ORDERED */
lc.addr, lc.child#, lc.gets, lc.misses, lc.immediate_gets, lc.immediate_misses, lc.spin_gets, lc.sleeps,
bh.hladdr, bh.tch tch, bh.file#, bh.dbablk, bh.class, bh.state, bh.obj
from
x$kslld ld,
v$session_wait sw,
v$latch_children lc,
x$bh bh
where lc.addr =sw.p1raw
and sw.p2= ld.indx
and ld.kslldnam='cache buffers chains'
and lower(sw.event) like '%latch%'
-- and state='WAITING'
and bh.hladdr=lc.addr
)
select bh_lc.hladdr, bh_lc.tch, o.owner, o.object_name, o.object_type, bh_lc.child#, bh_lc.gets, bh_lc.misses, bh_lc.immediate_gets,
bh_lc.immediate_misses, spin_gets, sleeps
from
bh_lc, dba_objects o
where bh_lc.obj = o.data_object_id(+)
order by 1,2 desc
/
You can spread the blocks in a number of ways, including:
1. Deleting and reinserting some of the rows by ROWID.
2. Exporting the table, increasing the PCTFREE significantly, and importing the data. This minimizes the number of rows per block
3. For indexes, you can rebuild them with higher PCTFREE values, bearing in mind that this may increase the height of the index.
4. Consider reducing the block size.
5. Consider implementing reverse key indexes
We generally think that the Latch structure is Mostly exclusive access, that is, there is very little chance of sharing access latches. However, Oracle generally claims to use the cache buffers chains in the shared mode when reading data. This has caused many people to think that reading will not occur with latch: cache buffers chains.
However, in most cases, the query still needs to hold the sub-latch in exclusive mode (sometimes it will be held in SHARED mode, depending on whether kcbgtcr is used when reading: kslbegin shared or kcbgtcr: kslbegin excl; kcbgtcr is Oracle The important function of getting consistent read in rdbms is Kernal Cache Buffer GeT Cosistents Read. Obviously, there are two ways to get cache buffers chains, namely kSLbegin shared and excl. Corresponding to it is kcbgcur: kslbegin, kcbgcur The meaning is Kernel Cache Buffer Get Current, which is used to get the current block for modification, that is, “write”; obviously kcbgcur: kslbegin function only needs to hold child cache buffers chains latch in excl exclusive mode, because It is a query statement but also needs to modify the buffer header structure, such as modifying the tch popularity, the hash variable of the holder list us_nxt, us_prv, and the hash variables of the wait list wa_prv, wa_nxt, and so on. In other words, reading and reading will cause Latch free: cache buffers chains to wait, instead of many people think that only reading and writing, writing will lead to cache chain latch contention.
V$LATCHHOLDER to see which sessions hold the latches the most. use X$KSUPRLAT to see hold mode.
select KSUPRLAT "address",KSUPRLNM "name",KSUPRLMD "mode" from X$KSUPRLAT;
In order to solve a CBC latch bottleneck we need to know what SQL is causing the bottleneck and what table or index that the SQL statement is using is causing the bottleneck.
Troubleshooting From ASH data this is fairly easy:
select
      count(*),
      sql_id,
      nvl(o.object_name,ash.current_obj#) objn,
      substr(o.object_type,0,10) otype,
      CURRENT_FILE# fn,
      CURRENT_BLOCK# blockn
from  v$active_session_history ash
    , all_objects o
where event like 'latch: cache buffers chains'
  and o.object_id (+)= ash.CURRENT_OBJ#
group by sql_id, current_obj#, current_file#,
               current_block#, o.object_name,o.object_type
order by count(*)
/
select
count(*),
lpad(replace(to_char(p1,'XXXXXXXXX'),' ','0'),16,0) laddr
from v$active_session_history
where event='latch: cache buffers chains'
group by p1
order by count(*);

select o.name, bh.dbarfil, bh.dbablk, bh.tch
from x$bh bh, obj$ o
where tch > 5
and hladdr='00000004D8108330'
and o.obj#=bh.obj
order by tch
Tanel’s ideas scripts
col object_name for a35
col cnt for 99999

SELECT
  cnt, object_name, object_type,file#, dbablk, obj, tch, hladdr
FROM (
  select count(*) cnt, rfile, block from (
    SELECT /*+ ORDERED USE_NL(l.x$ksuprlat) */
      --l.laddr, u.laddr, u.laddrx, u.laddrr,
      dbms_utility.data_block_address_file(to_number(object,'XXXXXXXX')) rfile,
      dbms_utility.data_block_address_block(to_number(object,'XXXXXXXX')) block
    FROM
       (SELECT /*+ NO_MERGE */ 1 FROM DUAL CONNECT BY LEVEL <= 100000) s,
       (SELECT ksuprlnm LNAME, ksuprsid sid, ksuprlat laddr,
       TO_CHAR(ksulawhy,'XXXXXXXXXXXXXXXX') object
        FROM x$ksuprlat) l,
       (select  indx, kslednam from x$ksled ) e,
       (SELECT
                    indx
                  , ksusesqh     sqlhash
  , ksuseopc
  , ksusep1r laddr
             FROM x$ksuse) u
    WHERE LOWER(l.Lname) LIKE LOWER('%cache buffers chains%')
     AND  u.laddr=l.laddr
     AND  u.ksuseopc=e.indx
     AND  e.kslednam like '%cache buffers chains%'
    )
   group by rfile, block
   ) objs,
     x$bh bh,
     dba_objects o
WHERE
      bh.file#=objs.rfile
 and  bh.dbablk=objs.block
 and  o.object_id=bh.obj
order by cnt
;
references Riyaj Shamsudeen ‘CBC and oaktables archive
Related Posts:
上一篇: event 10046 简单使用
下一篇: 关于深入shared pool

 微信扫一扫,打赏作者吧~


目前这篇文章有1条评论(Rss)评论关闭。